Hi this is Jacob, both me and Eric have been deep in our studies and thus it has been hard to post for a while. Therefore I know it has been a long waiting for the winter forecast. So here it starts:
I actually have two different ideas of what I am guessing might happen this winter
#1-History and also my gut feeling says that we will be drier than normal, with normal temperatures, and below normal snowfall.
#2-History and Nature have been leaning towards this side. What happens is when there are a bunch of La Nina's then an El Nino there is usually a very chilly east with a warm west which would make North Carolina in the cool temperatures. When this happens it is usually wetter than normal also which would make the perfect combo for lots of snow.
Sorry this was kind of brief but this is preliminary so i could just as easily be wrong as i could be right at this point if you want to see my Video for the nation for the winter then click this link: http://www.youtube.com/watch?v=lmQuXnoVjsM
Saturday, October 5, 2013
Tuesday, August 20, 2013
Keeping close eye on tropics, Category 5 Cape Verde hurricane this season?
As many of you have probably observed, on my website at weather advance, I released my hurricane season predictions all the way back in March & made my official hurricane season map based on these ideas, & this was heavily based on the storm tracks of the analog years 1960, 1969, 1979, 2004, 2010, & in one of most recent posts there I included 1996.
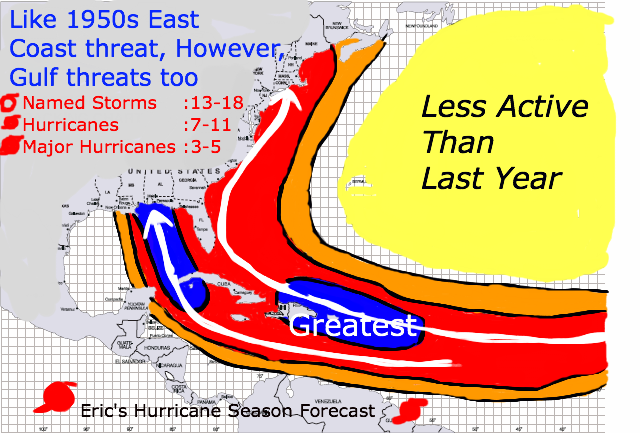
My hurricane season predictions, based on ideas I released all the way back on March 24th, ahead of just about every other hurricane forecasting prediction & related agencies (even weatherbell.com), which was considerably early being released only days following my prediction.
Weatherbell.com March hurricane season forecast (that has since been changed by Joe Bastardi, you wouldn't know that unless you have a premium subscription there.)
.jpg)
There were several parameters that went into that hurricane season package, the most important by far in my opinion being the solar cycles in relation to US hurricane season landfalls. In case you have not seen this on weather advance, I will post my research that I have gained since 1880 in accordance to US hurricane landfalls & the extremities (peaks & minimums of the solar cycle).
Here’s what I collected in the data since 1880, is that there were 452 tropical systems of tropical storm strength or greater to make landfall on the US coast, with a total of 224 hurricanes to make landfall and 78 major hurricanes that have hit the coast. In the sunspot cycle years of extreme maximum or minimum in the overall solar cycle, there were 52 years used including (many of which mentioned above) 1886,1887, 1888, 1889, 1893, 1894, 1899, 1900, 1901, 1902, 1906, 1907, 1911, 1912, 1913, 1915, 1916, 1917, 1921, 1923, 1926, 1927, 1928, 1929, 1933, 1934, 1935, 1938, 1944, 1947, 1948, 1949, 1953, 1954, 1957, 1964, 1968, 1969, 1976, 1979, 1981, 1985, 1986, 1989, 1990, 1991, 1996, 2000, 2002, 2008, and 2009. There were a total of 80 remaining years since then, and when you compare the total number of storms in minimum and maximum sunspot years to non-years you get 204 tropical storms in sunspot years to 248 in non-years. However, it is very significant to see that the number of landfalling hurricanes in the sunspot years at 117 & 42 respectively, is actually more than non-years which have 107 & 36 for hurricanes and major hurricane landfalls respectively. Now, such differences may not seem like much, however, considering that in non-years, there are 28 MORE hurricane seasons into that data as opposed to sunspot years, and there is still significantly less hurricanes and major hurricanes on the US coast, this is very telling that there is indeed some definitive trend in sunspot cycle minimums and maximums to US hurricane landfalls. The results get even more surprising when you take the average number of landfalling tropical storms, hurricanes and major hurricanes of those years, with the 52 sunspot years which are significantly higher on average than non-years. Average number of tropical storms making landfall on the US coast in the sunspot years analyzed is 3.9 per year, with non-years only at 3.1 per year. Hurricane landfall average in sunspot years is 2.25 as opposed to only 1.3 in non-years, with major hurricane average frequency in sunspot years at .81 with non-years at only .45 on average. This tells you that given the data, tropical storms during extreme periods of solar maximum or minimum are 21% more likely to make landfall on the US coast, hurricanes 40% more likely and major hurricane landfalls are 44.3% more likely in years of solar extremes. Now, I do recognize that seasons like 2004 & 2005 are certainly exceptions, as are various other years to this overall trend in increasing hurricane landfalls, but when I remove just those 2 seasons from the data going back to 1880, considering them somewhat as outliers, the trend is increasingly evident. Of course, just removing these two years still leaves the non-sunspot years with 26 MORE hurricane seasons than sunspot years. The overall increased probability in the number of tropical storms or greater seems relatively unaffected with a still significant, but not a huge change in overall probability, up to 24% more likely in sunspot years. The hurricane probability seems moderately affected with an increase in difference of probability of about 6% from the data without these years. However, the number of major hurricane landfalls on the US coast is extremely affected without 2004 & 2005, a 11% difference in probability to now about 55% more likely to see a major hurricane landfall in a sunspot extreme year versus a non-year. In fact, with just 2004 & 2005 removed from the non-years there are only 29 major hurricanes in those 78 hurricane seasons to make landfall on the US, while when I looked at just high sunspot cycle years I analyzed like 1893, 1894, 1906, 1907, 1915, 1916, 1917, 1926, 1927, 1928, 1929, 1947, 1948, 1949, 1957, 1968, 1969, 1979, 1981, 1989, 1990, 1991, 2002 & 2002, there were in just those 26 years, 27 major hurricanes on the US coast, which makes both sets of data with 78 non-sunspot cycle years to just 26 sunspot years virtually equal in the amount of major hurricanes on the US coast. This means that when comparing these two sets of data that major hurricane landfalls in high sunspot years are about 280% more likely to occur than in non-years, absolutely amazing. The overall conclusion here is that my original suspicions of that there is a relationship between sunspot cycles and US hurricane and major hurricane landfalls is verified by looking at this data.
From there, I was able to further my analysis & was able to figure out why there were some years that correlated very well with the solar cycle peaks & minimums & other years that didn't do so well. This I suspect has a lot to do with the stratosphere-troposphere relationship, which is much like what I deal with when I talk about stratospheric warming & expansion of the atmospheric column above the surface. In this case, I have a suspicion that when I looked at the sunspot cycle data, I noticed in the years that did correlate well with the solar cycle- US hurricane landfall relationship, the sunspot numbers in the May-July & November period surrounding the peak of the hurricane season were relatively higher than September, & this made some sense to me as to why this relationship works. Really thinking about it, even on monthly scales, the sunspot cycle can have large effects on the atmospheric column, & with lower sunspot numbers observed in periods of overall higher landfalls on the US coast, I considered that given how sunspots lower in September in comparison to the other surrounding months, the atmosphere, since most of it lies within the troposphere, in that during periods of lower solar activity, the amount of ozone necessary to block harmful UV radiation is reduced (UV radiation varies much more in the solar cycle than other electomagnetic wavelengths like infrared), thus the radiation emitted from the ozone that helps to provide the warming with increasing atmospheric height in the stratosphere is reduced, thus leading to a subsequent cooling of that atmospheric layer. This in turn also gives the troposphere below an opportunity to expand & warm. A warming troposphere in the tropics is beneficial to tropical cyclone genesis as it further promotes the release of latent heat in the atmosphere which is a result of water vapor condensing into its liquid state. In doing so, the molecules within the liquid state of water compared to the condensed gaseous state can't move as freely about, & have a tendency to move much slower, thus allowing them to move closer to each other, there by forcing a subsequent release of energy, mostly in the form of heat to compensate for this loss of movement. In fact, only a small percentage of a tropical cyclone's latent heat energy is actually converted into wind energy, giving the storm a low overall efficiency of converting latent heat energy to wind energy.
This picture below helps to describe some of the processes I talked about above in relation to the stratosphere-tropospheric relationship.

Now, another one of the factors I talked about in my hurricane season forecast & this is one I'm going to take a much closer look into is the Indian Ocean Dipole. I explained the Indian Ocean Dipole (IOD) in my June post at weather advance, & I'll post it here so you have an idea what I'm talking about.
"The Indian Monsoon Circulation is also heavily related to the Indian Ocean Dipole Index, which is a measure of the difference in the water temperatures over the west Indian Ocean between 10 degrees north and south latitude and 40 and 70 degrees east longitude, and the eastern Indian Ocean between 0 and 10 degrees south latitude and 90 to 110 degrees east longitude. When water temperatures are warmer in the western Indian Ocean, comparative to the eastern Indian Ocean, this is a positive (+) Indian Ocean Dipole, where as the opposite is true, a negative Indian Ocean Dipole (-) when the waters are warmest over the eastern Indian Ocean. This picture below helps to illustrate this relationship between the water temperatures in the western and eastern Indian Ocean and the Indian Ocean Dipole."

I helped to explain this concept of the Indian Monsoon & its circulation in my post back in June
"The Indian Monsoon Circulation varies throughout the year with the summer generally featuring the ocean being cooler relative to the surrounding landmass, thus regions of higher than normal pressure develop over the ocean and the warmer air over land naturally rises inducing low pressure, and as a result, knowing that air naturally flows from regions of high to low pressure, this forces warm, moist air from the Indian Ocean over southern Asia, the Middle east, and eastern Africa. As the air rises due to a combination of orographic processes (which involve the forcing of air to rise due to sudden changes in topography, such as mountains, that naturally force air upwards) and Adiabatic cooling (which is the natural decrease in temperature of a parcel of air due to increasing altitude), it condenses and comes down in the form of rain, much of which is needed in this region as upwards of 70-80% of their rainfall comes from the summer monsoon.

Now looking at what effect the Indian Monsoon would have on tropical activity, let's look at the actual data of the Indian Monsoon & Indian Ocean Dipole & compare the various hurricane seasons to see which phase of the IOD is more favorable to tropical cyclone genesis in the Atlantic, or perhaps if there really isn't much of a correlation at all. For this data collection & analysis, I'm going to focus on the "prime development region" of the deep tropical Atlantic from south of 20 degrees north latitude to 60 degrees west longitude, studying the tropical activity in this region of the Atlantic will help to give you a better overall indication of the Indian Monsoon & IOD's effects on tropical activity because this area of the Atlantic is furthest east & thus closest to the Indian Ocean & Africa where the Indian Ocean Dipole plays a large role in the weather and of course unlike the areas further to the north & west in the Atlantic, this region is not as influenced by environmental factors as a result of the North American continent.
Here's a picture representation of what I coin as the "deep tropical Atlantic" or "Prime development region" from 20 degrees north latitude, southwards & east of 60 degrees west longitude.

According to the Australian Bureau of meteorology, they have identified 11 +IOD years since 1958, & 10 -IOD years, those years are as follows for the + IOD 1961, 1963, 1967, 1972, 1977, 1982, 1983, 1994, 1997, 2006, & 2007 & for the -IOD they are 1958, 1960, 1964, 1971, 1974, 1975, 1989, 1992, 1993, & 1996.
Here's the data I gathered for all the activity in the +IOD years in the "prime development region
1961- 4 TS, 3 hurricanes, 1 major
1963- 6 TS, 4 hurricanes, 1 major
1967- 2 TS, 0 hurricanes, 0 majors
1972- 0 TS, 0 hurricanes, 0 majors
1977- 2 TS, 0 hurricanes, 0 majors
1982- 1 TS, 0 hurricanes, 0 majors
1983- 0 TS, 0 hurricanes, 0 majors
1994- 2 TS, 1 hurricane, 0 majors
1997- 1 TS, 1 hurricane, 0 majors
2006- 4 TS, 1 hurricane, 0 majors
2007- 5 TS, 2 hurricanes, 0 majors
Here's the data I gathered for the 10 -IOD years since 1958
1958- 5 TS, 3 hurricanes, 1 major
1960- 1 TS, 1 hurricane, 1 major
1964- 4 TS, 3 hurricanes, 1 major
1971- 1 TS, 0 hurricanes, 0 majors
1974- 2 TS, 1 hurricane, 0 majors
1975- 2 TS, 1 hurricane, 0 majors
1989- 7 TS, 3 hurricanes, 2 majors
1992- 1 TS, 0 hurricanes, 0 majors
1993- 2 TS, 0 hurricanes, 0 majors
1996- 6 TS, 4 hurricanes, 2 majors

However, when convective activity increases over the African continent & generally regions in east juxtaposition to the Atlantic basin, this will force the westerly winds in the upper levels to slow down, to even at some points come out of the east as well. This is due to the enhanced upper level divergence created by the convective & meso-scale thunderstorm complexes, where in winds at the upper levels go outwards in all direction.Thus, when you have winds going in the same direction with increasing height in the atmosphere, this decreases wind shear & allows for tropical vortices to become vertically stacked in the atmosphere, which is favorable to tropical cyclone development. This is also the reason why the phases 6 & 7 of the MJO are so unfavorable to the Atlantic, while even phases 4 & 5, which are towards the Maritime continent, that would generally favor downward motion in the tropics can still be somewhat favorable for tropical Atlantic activity because the upper level divergence from the thunderstorms going off to the east of the Atlantic tends to lower wind shear across the basin.
Looking at the MJO at the current time, you can see the Atlantic is currently in the downward phase of the MJO, thus sinking motion is generally favored, & also notice the upward motion going off in the eastern Pacific, this is leading to increased wind shear values across the tropical Atlantic as the upper level divergence from those thunderstorms coming out of the west, actually will enhance the upper level westerlies, thus in conjunction with the lower level easterlies in the tropics, create wind shear issues for tropical cyclones or developing tropical disturbances.
You can see in this picture below showing upward motion potential as well as the infrared satellite revealing that in the shades of brown, the Atlantic as a whole is in a suppressive phase of the MJO, while the Maritime Continent region & eastern Pacific to the southeast of Hawaii where we have hurricane Henriette, are in the upward phase. However, I do notice recently that some upward motion is beginning to creep its way slowly westward towards Africa. It's thanks to this downward MJO phase that the Atlantic still remains relatively quiet, that will change though as soon as the upward MJO moves in to the Atlantic. Interestingly enough, a lot of the upward motion from the MJO is located in the southern hemisphere, which is still a mystery to me as to why this is the case.

+IOD years since 1958, SST composite showing an el nino like signature in the equatorial Pacific with cooler than normal waters in the Atlantic. Such a set-up with the immediate surrounding ocean basins warmer relative to the Atlantic would have a tendency to favor downward motion in the Atlantic, not favorable for tropical cyclones. Also, I can see why the water temperature pattern of warmth near the north Indian Ocean & cool near Indonesia is unfavorable, because with el nino, or el nino like conditions in place, this forces pressure falls in the east Pacific, while forcing a general pressure rise towards the Maritime continent, as a result of this, in the Indian Ocean, winds will come out of the east in the lower levels of atmosphere due to the large scale high pressure which leads to water being generally pushed away from Indonesia, thus leading to cool water upwelling there & warm water near the Arabian Sea & eastern Africa as the winds push the water against the coast, forcing it to downwell, leading to a larger column of warmer water not just at the surface but to an extended depth as well.

Compare this against the -IOD years SST composite & you can see the opposite is true, in that SST distribution pattern actually favors upward motion in the Atlantic, with winds going in the opposite direction in the Indian Ocean, that forces water to upwell of the Arabian Sea & east African coast, while forcing a piling up of water to downwell towards Indonesia & the Maritime continent's side of the North Indian Ocean.

Interestingly, you can see much like this year, the Atlantic is not overbearingly warm, however, for the sake of -Indian Ocean Dipole years, it was enough warmth relative to the surrounding oceanic environment to provide upward motion & help with the development of tropical cyclones.

I dug even further into the Indian Ocean Dipole years, & even though recent hurricane seasons since the cold PDO flip in 2008 aren't officially affiliated with any side of the Indian Ocean Dipole, I looked at the time series over the last several years to get an idea which way specifically certain hurricane seasons were leaning, thus I could also make other observations about years which have a certain bias towards one side of the Indian Ocean Dipole. Since 2008, I identified 3 years with a positive Indian Ocean Dipole, being 2008, 2011, & 2012, while 2 years, 2009 & 2010 were deemed as negative leaning Indian Ocean Dipole years.
Here's the graph showing the Indian Ocean Dipole index, most notable is a year like 2010 which had an abnormally strong dip in the Dipole towards negative, which interestingly correlated with that season's high amount of activity in the deep tropics.

Looking at the actual numbers for tropical development in the "prime development region" of the Atlantic, 2008, which was slightly biased towards a positive Indian Ocean Dipole experienced only 1 hurricane & 1 major hurricane in that area of the Atlantic, hurricane Bertha, which actually occurred in July
2008 hurricane season

Hurricane Bertha (2008)


The other 2 positive Indian Ocean Dipole years of 2011 & 2012 combined for only 1 hurricane in the prime development region of the tropical Atlantic, hurricane Katia in 2011.


Compare this against only 2 years of a -Indian Ocean Dipole, with 2009 being an el nino year at that, what's interesting about this is that 2009 featured 2 hurricanes & 2 majors hurricanes in the deep tropics, more than all the other 3 +IOD years combined with hurricanes Bill & Fred. 2010, of course featured a frenzy of storms in the deep tropics, with 5 hurricanes.
2009 hurricane season
2010 hurricane season

In all, there were only in the 3 +IOD dipole years, 2 hurricanes & 1 major hurricane, while just 2 years of a -IOD featured 7 hurricanes & 4 majors in the deep tropics, fairly astounding. However, I didn't stop there, just to make sure my data was correct I analyzed this area of the tropics south of 20 north & east of 60 west further in that I looked at & calculated the ACE index or Accumulated Cyclone Energy in this area of the tropics in each year. The ACE index itself is a general measurement used by NOAA & the NHC, particularly in the Atlantic Ocean Basin to account for the amount of energy a tropical cyclone produces over its entire lifespan, measured in 6 hour intervals. This may seem a bit complex but it's really not that hard to calculate hurricane ACE index, all you do is you add the sums of the squares of a given tropical cyclone's maximum wind speed in knots (for example, like 35^2 +40^2 +45^2, etc..) & then you get a very large number, which you then in turn multiply by 10^-4 or divide by 10,000. For our sake, I calculated & focused in on the deep tropical Atlantic & calculated the individual ACE for each storm to give a season total which I compared against other years that were in different phases of the Indian Ocean Dipole.
Here's the data I collected
ACE index for all storms since 2008 in the "Prime Development Region" of the Atlantic south of 20 degrees north, east of 60 degrees west.
Hurricane Bertha (2008) 4.955
Hurricane Ike (2008) 1.7875
Tropical Storm Josephine (2008) 3.07
Tropical Storm Nana (2008) .49 Season total: 10.39 ACE
Tropical Storm Ana (2009) .8575
Hurricane Bill (2009) 12.48
Tropical Storm Erika (2009) .5275
Hurricane Fred (2009) 9.805
Tropical Storm Henri (2009) 1.215 Season total ACE in "prime development region": 24.88
"Tropical Storm Colin (2010) .245
Hurricane Danielle (2010) 5.41125
Hurricane Earl (2010) 4.419
Tropical Storm Fiona (2010) 1.022
Tropical Storm Gaston (2010) .245
Hurricane Igor (2010) 24.653
Hurricane Julia (2010) 8.483
Hurricane Lisa (2010) 2.53
Hurricane Tomas (2010) 1.418 2010 hurricane season ACE index total in "prime development region": 48.43
Hurricane Irene (2011) .278
Hurricane Katia (2011) 6.816
Hurricane Maria (2011) 1.733
Hurricane Ophelia (2011) 3.833
Hurricane Phillipe 3.533
2011 season total ACE in "prime development region": 16.2
Hurricane Ernesto (2012) .713
Tropical Storm Florence (2012) 1.513
Hurricane Isaac (2012) .845
Tropical Storm Joyce (2012) .245
Hurricane Leslie (2012) 3.22
Hurricane Nadine (2012) 1.145
Tropical Storm Oscar (2012) .587 2012 hurricane season total ACE in "prime development region" 8.27
Now when you compare -IOD years to +IOD years not only in terms of actual hurricanes & major hurricanes, but now also hurricane Accumulated Cyclone Energy (ACE) Index this is what you get for all years since 2008, 2009 & 2010, the two negative IOD years easily beat all of the other +IOD years.
ACE index ranking for prime development region in Atlantic for + & -IOD years since 2008. (Interesting the -IOD year of 2010's ACE alone beats all of the other +IOD years combined, just goes to show a -IOD is favorable for tropical cyclones.)
#1 Negative IOD 2010- 48.43
#2 Negative IOD 2009- 24.88
#3 Positive IOD 2011- 16.42
#4 Positive IOD 2008- 10.39
#5 Positive IOD 2012- 8.27
Thus, given this data presented above it's very clear that the negative phase of the Indian Ocean Dipole that features cooler than normal water over the north Indian Ocean is favorable to tropical cyclone genesis & the negative phase is usually associated with la nina or "la nina-like " conditions in the Atlantic that can further enhance activity, while the positive phase with warmer than normal water in the North Indian Ocean is generally suppressive & is closely associated with el nino events. I dug a little further into this pattern though, & considered that we are in a neutral ENSO phase, thus I could narrow down a list of years which are more like this season in that we have a -Indian Ocean Dipole & neutral ENSO. Five years came up since 1958 that had this kind of pattern, 1958, 1960, 1989, 1992, 1996.
The rainfall in those years' southern hemisphere winter & spring, courtesy of the Australian Bureau of Meteorology looks like this in Australia.

Compare that above to this year's precipitable rate so far this summer at the 1000mb level, looks fairly similar with drier than normal conditions across northern regions of the continent & subsequent wetter conditions further south.

What is more intriguing about those years is that in the Atlantic hurricane season, 4 out of 5 of those hurricane seasons had a category 5 Cape Verde hurricane, something I discussed in my most recent post at weather advance & will show once again below.
In 1958, there was hurricane Cleo, interesting the last category 5 hurricane to go out to sea, every one since then has hit landmasses further west like the Caribbean Islands & the US.
1958 Hurricane Cleo

1960's hurricane Donna

Hurricane Donna satellite as it was in the Florida Straits as a category 4 hurricane

1989's Hurricane Hugo

Of course, thanks to hurricane Hugo, this helped to give rise & significant popularity to the Weather Channel
1992's Hurricane Andrew

Here are the videos showing the coverage of this extremely dangerous & powerful hurricane
Part 1
Part 2 of hurricane Andrew as it happened
Part 3
Part 4

These ideas for a category 5 Cape Verde hurricane this year are further supported by more evidence I provided in my most recent post at weather advance, I'll post that information here.
The last official time a category 5 hurricane turned out to sea was all the way back in 1958 with category 5 hurricane Cleo!

In fact, looking at the official stats on category 5 hurricanes, the Atlantic has seen 34 category 5 hurricanes since 1924, & out of those 34 systems, 31 of them ended up hitting land, giving us a figure that about 90-95% of all category 5 hurricanes in the Atlantic basin end up hitting land, including the United States coastline, a staggering figure. Of all of these category 5 hurricanes, 14 of them formed in the eastern Atlantic (generally from 40 degrees west & points eastward, which would usually mean that the chances of such a storm turning out to sea is abnormally high. However, of these 14 storms, only two hurricanes Easy (1951) & hurricane Cleo (1958) turned out to sea, all other storms eventually went onto hit landmasses further west, giving us a percentage of about 85% of all category 5 hurricanes which form in the eastern Atlantic end up hitting land, another astonishing figure. The interesting aspect about these Cape Verde category 5 hurricanes is that their relative frequency is more closely associated with African Sahel rainfall.

There's plenty of good reason for this as an increase in Sahel rainfall generally favors stronger than normal & more moist African waves, thus as a result, the increase in thunderstorm activity allowed for substantial increases in warming of the atmospheric column that naturally favors tropical development through latent heat release. Also, the increase in rainfall limits the frequency & overall strength of African dust that along with a stronger than normal Azores high providing subsidence warming aloft, forces air to pile up in the mid-levels & thus leading to surface convergence. This overall process causes a trade wind inversion where warmer air aloft prevents much in the way of surface thunderstorm activity from accelerating & ascending upwards, and the dust in association with the Saharan Air Layer (SAL) limits the amount of incoming solar radiation to the surface, cooling the air near the surface, including the ocean. In essence, this trade wind inversion leads to an overall unfavorable environment for tropical cyclones, partially as a result of decreased Sahel rainfall. You should note that from about the 1920s to the mid 1960s, Sahel rainfall was above normal, thus indicative of an overall favorable environment for stronger African easterly waves that lead to generally increased levels of tropical cyclone genesis in the deep tropical Atlantic. However, from the mid 1960s to about the mid 2000s, somewhat in tandem with the AMO cycle, a cold AMO & decrease in Sahel rainfall led to decreased strength in African easterly waves, which led also to a decrease in category 5 Cape verde hurricane frequency from its climax in the 1920-1965 period of around 4-5 years per category 5 Cape Verde storm to 7-8 years from 1965 to 2000.
Here's that same picture, I added Cape Verde category 5 storms into it so you can see the correlation between that & Sahel rainfall.

The most interesting information I found out by looking at this picture above was that Sahel rainfall & category 5 Cape Verde hurricanes in general although they do correlate with periods of high & low rainfall, seem to be more closely related to rainfall in relation to the surrounding time period. This is especially true when looking at the period from about 1960 to the early 1980s, where although rain in the beginning was above normal there was a complete lack of category 5 Cape verde hurricanes, & this was interesting also given the fact that we had a higher frequency of category 5 Cape Verde hurricanes in the mid-late 2000s when Sahel rainfall was below normal. also, even the period in the late 1930s & into the 1940s when overall rainfall was still above the mid-late 2000s level, yet there weren't any category 5 Cape Verde systems. What this information implies is that even though there is a correlate as a whole with increasing Sahel rainfall & generally more category 5 Cape verde storms, it appears that these systems are more closely associated with overall trends in rainfall, & this is evidenced by the decrease in rainfall from just after 1960 to the early 1980s resulting in the formation of only 2 Cape verde hurricanes (David & Allen) & resulting in a 19-year lull in category 5 Cape verde hurricanes, the longest on record since the 1920s. Also, the 9-year lull in category 5 Cape Verde storms from 1938 following the Long Island Express to 1947's Ft. Lauderdale hurricanes correlates with a notable, but less significant decrease in Sahel rainfall during this time period. The general trend upwards in Sahel rainfall since the 1980s has resulted in several formations of category 5 Cape Verde hurricanes, with 3 occurring in the mid-late 2000s (Isabel, Ivan, & Dean), despite overall rain being below normal. What all of this data implies is that yes Sahel rainfall is correlated to the formation of category 5 Cape Verde hurricanes, but is more closely associated with rainfall trends in a given period, with downward trends, even in periods of relatively high rainfall resulting in fewer storms, while increasing rainfall, even in times of overall drier than normal conditions on the Sahel results in more storms. Given this information, it is important to note that since the 1990s & 2000s, Sahel rainfall is on the increase and given that we haven't seen a category 5 Cape verde hurricane in 6 years under increasing Sahel rainfall, suggests that given history, we should soon see a category 5 Cape verde hurricane. Also knowing that our rainfall is on the increase, we are going to likely see an increase in category 5 Cape verde hurricane frequency over the next several years & decade or two, despite the AMO likely entering its cold phase by then.
Further evidence I used to support this idea for a category 5 Cape Verde hurricane this season is based on what was observed this year where we had 2 Cape Verde developments, Chantal & Dorian east of the Lesser Antilles before August. Now, for this set of years, given the rarity of seeing 2 tropical storms form east of the Lesser Antilles in July, (this year was the first time this has happened since 1926 & with TS Erin developing on August 15th, it was the 1st time since 1887 & only 2nd time in history we've had 2 Cape Verde developments in July & another system develop east of the Lesser Antilles by August 15th.) I made the requirements for this set of years relatively loose with the requirement that they must have at least on tropical storm & another system of tropical depression strength or greater develop east of the Lesser Antilles before August. The years that came up in that set of data were 1966, 1969, 1979, 1989, & 2003. Interestingly, out of these 5 hurricane seasons, 3 out of 5 had a category 5 Cape Verde hurricane.
1979's Hurricane David (one of my hurricane season analog years)

1989's hurricane Hugo

2003's hurricane Isabel, the only hurricane in history along with Ivan in 2004 & Allen in 1980 to achieve category 5 hurricane status 3 separate times.


The other years which didn't have a category 5 Cape Verde hurricane, 1969 & 1966, were still fairly memorable hurricane seasons, especially 1969's hurricane Camille, which attained maximum sustained winds of 190 MPH before striking the Mississippi coast in August 1969.

1966's hurricane Inez was almost a category 5 hurricane at one point, achieving maximum sustained winds of 155 MPH, just shy of category 5 status, still was a very devastating hurricane to the Greater Antilles & Mexico in spite of the fact that it failed to strength into a category 5.
.png)

Now, where potentially would this category 5 Cape Verde hurricane track? Just look at history & the 14 storms which were Cape Verde category 5 hurricanes, which by my definition formed at or east of 40 degrees west, where naturally the chances are relatively high for a storm to recurve out to sea. In the case of category 5 Cape verde hurricanes, the majority of them track west-northwestward to near & just to the northeast of the NE Caribbean & Puerto Rico, from there many go on to hit the eastern seaboard & even the Gulf. A few southerly tracking systems like hurricane Allen, Dean, & Ivan make for some of the most infamous "caribbean cruiser" hurricanes.
Now, given that we have observed above normal Sahel rainfall this year & are in an overall upward trend in precipitation, this suggests that the formation of a category 5 Cape Verde hurricane within the next several years is relatively high to begin with. However, we haven't observed a category 5 Cape verde hurricane since Hurricane Dean in 2007, a 6-year period without a category 5 Cape Verde hurricane in an overall wet Sahel & increasing precipitation is uncommon.Yet, with the already observed favorable conditions in the eastern Atlantic as evidenced by the formation of tropical storms Chantal & Dorian before August 1, & in looking at those hurricane seasons which had 2 tropical cyclones in the east Atlantic before August, half of which had category 5 Cape Verde hurricanes, the odds of this year seeing a category 5 Cape Verde hurricane are relatively high. Also given that 12 out of the 14 category 5 Cape Verde hurricanes have hit landmasses further west, there's certainly concern, if such a storm were to form, that landmasses, including the US coastline could be threatened. If you also take into account that of we are in an active hurricane "series" as described earlier in this post & we're currently in a similar cycle of PDO/AMO as the 1950s, when the category 5 Cape Verde hurricane Donna hit the US eastern seaboard as a major hurricane & a period when 8 major hurricanes hit the US east coast.....

Given the conditions at hand, things certainly are pointing towards the east coast for a potential hit from a category 5 Cape Verde hurricane this year (no one is saying or should be saying with any certainty that we'll see a category 5 landfall), & this is also supported by climatology of such storms, in that of the 14 category 5 Cape Verde hurricanes, 8 of them hit the east coast of the US (57% of all category 5 Cape Verde hurricanes), thus if any region of the US coast should be wary this year of impending hurricane threats, its the US east coast.
If anything, I'm even more confident in my forecast & in fact I am going out on a limb & saying that the odds are quite high this season (70%) for a category 5 Cape Verde hurricane this year, which is 3-4 times the 1928-2012 climatological mean of 15-20%, regardless of what occurs, it will still be an active Cape verde hurricane season.

Also, I will add if you like my posts at weatheradvance and here & wish to see my other material, well there's a link to ALL of my posts , going back to when I started as a forecaster at weatheradvance last August ( I think you would be amazed at the amount of growth I've shown) they are available here for enjoyment & reading pleasure.
(link) http://weatheradvance.com/author/eric-webb/
Saturday, July 6, 2013
Tropical Update-Tropical Storm Chantal?
Tuesday, July 2, 2013
Get a whiff of this
Ok, just to clarify for all of you "sick-minded" people out there, lol (jk) I'm not talking about this...

No, I'm actually talking about a comment I recently made to Jacob Thorne on his blog, obviously him taking about a tropical system going into the Bahamas or the Gulf got me all riled up into making a very long response, which I think is worth mentioning here.
I'm glad you liked it, but I am not going to hang my hat on
any solution at this point, as these types of situations where we have an upper
level low pressure system transitioning to a warm-core tropical system, not to
mention a few easterly waves getting involved, this type of set-up is naturally
hard for the models to handle. Also, with such small scale features such as an
upper level low pressure system in an overall region of relatively high
pressures, the models can tend to miss these kinds of systems they "slip
under the radar" per say and of course when you have a small-scale
feature such as an upper level low pressure system forming in a relatively high
pressure environment, the resulting tropical cyclone (if one even forms) tends
to be small & compact in nature. It's these environmental factors in a
storm's formation that help to determine the overall "personality" of
a tropical cyclone and make each one unique (factors like size, convective
structure, etc..), & if we had this storm system forming out of the
monsoonal circulation over central America, then this storm would tend to be
rather large in nature as the environment in that region is relatively low in
overall pressure and the convective disturbances in that region are also
rather large, which lead to the formation of large tropical cyclones (The East
Pacific's Hurricane Cosme is a great recent example, Tropical Storm Arthur in
2008 and Arlene in 2011 are good examples for Atlantic storms).
Tropical Storm Arthur (2008)


Tropical Storm Arlene (2011)


Also what
needs to be taken into consideration when determining the characteristics of a
tropical system when dealing with potential formation is the amount of time
that it takes for a tropical system to form, usually smaller storms tend to
form much more quickly compared to larger storms as the sudden strengthening
forces the circulations of the system to tighten up and shrink, forcing the
overall structure of the storm to shrink as well and the opposite can be
applied to when dealing with larger storms. This concept can actually
complicate matters somewhat if other environmental conditions dictate that such
a storm is to be smaller in overall size (like higher than normal pressures,
formation in a high pressure environment), as slower formation can induce the
circulation to be larger and broader in nature than it would otherwise if it
didn't develop slowly.
The opposite can be said about a storm that
forms rather quickly in a relatively low pressure environment or from rather
large convective features, hurricane Andrew in 1992 may be a decent example of
this as it initially formed from a tropical easterly wave, which although
usually result in storms that are around average in size Andrew ended up being
extremely small and this can be attributed to the fact that it underwent a
period of extremely rapid intensification, in fact a drop in pressure of 47
millibars on August 22nd ( a pressure drop of 2 millibars per hour) to 922
millibars, and it weakened slightly over the Bahamas because of some land
interaction and an eye wall replacement cycle, but was able to attain a minimum
central pressure of 922 millibars once again upon landfall in south Florida in
Elliot Key, making it the 4th lowest minimum central pressure of any tropical
cyclone making landfall on the US coast, behind the Labor Day hurricane of 1935
(892 millibars), Camille (1969) (909 millibars) and Katrina (2005) (920
millibars).
Hurricane Andrew (1992)


The strengthening of Andrew can also be attributed to an equatorial Kelvin Wave (I talked about this at weatheradvance) which was detectable by the fact that the SOI (Southern Oscillation Index) dropped steeply negative about the exact same time Andrew underwent rapid intensification, and when the SOI is negative that is indicative of lower than normal pressures at Tahiti, French Polynesia in the central Pacific and Darwin, Australia (these two observations sites and their associative pressure differentials in comparison to normal is what determines SOI, and the SOI is also a good indicator of the ENSO index, which in large -SOI events usually goes into its el nino state because when you have lower than normal pressures towards Tahiti along with pressures being higher than normal towards Darwin, Australia, this indicative of higher pressure towards the western Pacific along with lower pressure towards the eastern Pacific, where air flow under high pressure naturally spreads out in all directions, thus forcing anomalous westerly winds in the Pacific. this disturbs the natural easterly trade winds found in the tropics under the Hadley Cell, thus leading to el nino as the warm pool of water naturally found in the western Pacific is forced to slosh westward, and this is what occurred in 1992 that led to the el nino that year which subsequently led to an overall inactive hurricane season as well.
This video helps to explain the relationship between easterly trade winds, el nino, and la nina as well as the Walker Circulation
(copy & paste the link into a new window)
http://www.youtube.com/watch?v=tyPq86yM_Ic
Also, another factor that I have considered in Andrew's sudden intensification is its relationship to the abnormally strong Bermuda High pressure to its north, where in this scenario the high pressure in this position not only blocks Andrew's forward progress towards the northwest and forces it farther to the west, but the pressure gradient between Andrew and the high pressure forces air to pile up and converge into Andrew, inducing a favorable environment for which Andrew can intensify in. However, such a strong pressure gradient over a relatively short distance, while forcing air to pile up into Andrew can be detrimental as this enhances the easterly trade winds at the surface and with these trade winds forced to speed up in the vicinity of Andrew under the abnormally strong high pressure, this induces surface divergence which induces higher than normal pressures at the surface that can severely disrupt surface circulations. This is the reason why in the central Caribbean, the region from the longitude of Puerto Rico to Jamaica is generally referred to as a "dead zone" as the pressure gradient between the Panama-Columbian Low and the Bermuda high induces surface divergence (especially early in the hurricane season) that disrupts surface circulations and severely limits tropical development. Also, the trade winds from the deep tropical Atlantic are also forced to be squeezed in between the Greater Antilles & South American coast that forces winds to speed up in this area along with the strong pressure gradient. However, you might say, well how about Hurricanes Allen (1980)
Hurricane Andrew (1992)


Here's part one of a series of videos that deal with the coverage of hurricane Andrew in 1992, this one has the best meteorological information & perspective of all of the videos.
The strengthening of Andrew can also be attributed to an equatorial Kelvin Wave (I talked about this at weatheradvance) which was detectable by the fact that the SOI (Southern Oscillation Index) dropped steeply negative about the exact same time Andrew underwent rapid intensification, and when the SOI is negative that is indicative of lower than normal pressures at Tahiti, French Polynesia in the central Pacific and Darwin, Australia (these two observations sites and their associative pressure differentials in comparison to normal is what determines SOI, and the SOI is also a good indicator of the ENSO index, which in large -SOI events usually goes into its el nino state because when you have lower than normal pressures towards Tahiti along with pressures being higher than normal towards Darwin, Australia, this indicative of higher pressure towards the western Pacific along with lower pressure towards the eastern Pacific, where air flow under high pressure naturally spreads out in all directions, thus forcing anomalous westerly winds in the Pacific. this disturbs the natural easterly trade winds found in the tropics under the Hadley Cell, thus leading to el nino as the warm pool of water naturally found in the western Pacific is forced to slosh westward, and this is what occurred in 1992 that led to the el nino that year which subsequently led to an overall inactive hurricane season as well.
This video helps to explain the relationship between easterly trade winds, el nino, and la nina as well as the Walker Circulation
(copy & paste the link into a new window)
http://www.youtube.com/watch?v=tyPq86yM_Ic
Also, another factor that I have considered in Andrew's sudden intensification is its relationship to the abnormally strong Bermuda High pressure to its north, where in this scenario the high pressure in this position not only blocks Andrew's forward progress towards the northwest and forces it farther to the west, but the pressure gradient between Andrew and the high pressure forces air to pile up and converge into Andrew, inducing a favorable environment for which Andrew can intensify in. However, such a strong pressure gradient over a relatively short distance, while forcing air to pile up into Andrew can be detrimental as this enhances the easterly trade winds at the surface and with these trade winds forced to speed up in the vicinity of Andrew under the abnormally strong high pressure, this induces surface divergence which induces higher than normal pressures at the surface that can severely disrupt surface circulations. This is the reason why in the central Caribbean, the region from the longitude of Puerto Rico to Jamaica is generally referred to as a "dead zone" as the pressure gradient between the Panama-Columbian Low and the Bermuda high induces surface divergence (especially early in the hurricane season) that disrupts surface circulations and severely limits tropical development. Also, the trade winds from the deep tropical Atlantic are also forced to be squeezed in between the Greater Antilles & South American coast that forces winds to speed up in this area along with the strong pressure gradient. However, you might say, well how about Hurricanes Allen (1980)
Allen (1980)

& Dean (2007)
Hurricane Dean (2007)

which were very strong hurricanes, (in
fact Hurricane Allen had the lowest recorded surface pressure in the Atlantic
until Gilbert broke that record in 1988) in the central Caribbean,
Here's a great video of hurricane hunters in the center of hurricane Gilbert, with meteorologist Jeff Masters and another scientist helping to describe the experience the hurricane hunters went through in Gilbert, and you should note the significant mentions of hurricane Allen back in 1980, which at this time was the "benchmark" storm, having the record for lowest minimum central pressure.
So how could this possibly happen? Well, I thought about this, & I think that this "feast or famine" scenario where storms that aren't fully developed don't intensify, as opposed to hurricanes that are already quite powerful continue to intensify, sometimes rather rapidly in the central Caribbean, I think that storms that are fully developed have a quality about them that allows them to turn the seemingly unfavorable environment with stronger trade winds inducing surface divergence to a very favorable environment that can allow for rapid intensification. When you think about fully developed storms as opposed to systems that are still trying to close off surface circulations, their wind fields are much larger and more organized with westerly, northerly, southerly, & easterly winds over a much larger area. These well organized winds fields essentially are able to "bend" the strongly easterly trade winds around them into a tropical wave like structure where winds in the wake of the wave are out of the southeast & winds ahead of the wave are out of the northeast. Using what we know about tropical waves where thunderstorms and convective activity are usually favored along and behind the tropical wave axis, this means that if we consider the well developed tropical cyclone in the central Caribbean reminiscent of a tropical cyclone, this would lead us to conclude that the circulation of the tropical cyclone is in the middle of the wave axis, thus in a favored position of the tropical wave where convergence is favored as the easterly trade winds, especially on the southern side of the tropical cyclone, are forced to change direction from easterly to southerly and southeasterly & if you apply the concept of turning a sharp corner in a vehicle, where the vehicle's inertia forces you to slow down once you reach the corner, the same concept can be applied to the trade winds in this case, which change direction as a result of the tropical cyclone, are forced to slow down and when air slows down over a distance, that leads to a piling up of air, which is then forced to rise, leading to surface convergence that is actually favorable for tropical cyclone development despite the central Caribbean naturally being a "dead zone" for tropical development due to enhanced easterly trade winds that severely disrupt surface circulations.
Here's a few pictures of a tropical wave & its structure to help to explain some of the phenomena I was referring to in the paragraph above


Ok, I really wasn't expecting this long of a response to
your comment, but I guess when things started flowing for me I really couldn't
stop, lol. I hope you enjoyed this post & learned a lot after reading this.
Subscribe to:
Posts (Atom)